- Research
- Paid
- Data Visualization, Graph Maker, AI Insights, Data Storytelling, Interactive Graphs
- 2 upvotes
You will be redirected to the official website.
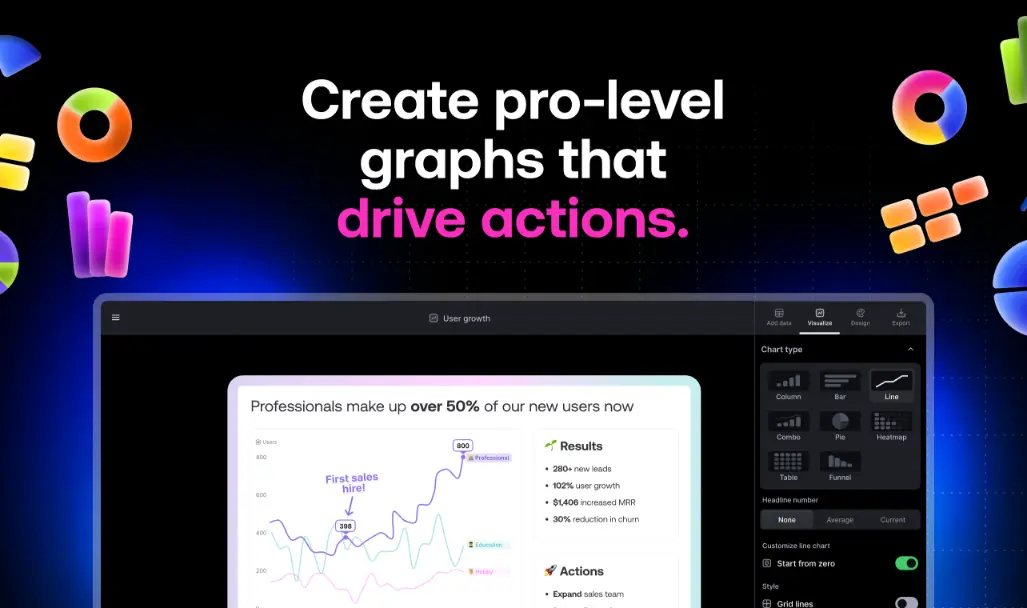
Graphy
Graphy is a data visualization tool that simplifies data presentation and communication for actionable insights.
Graphy is an intuitive data visualization tool powered by AI, designed to help users create interactive graphs and charts swiftly. It transforms raw data into engaging visual narratives, making it an excellent choice for marketers, analysts, and business professionals who need to convey insights clearly and impactfully.
This tool’s ease of use, combined with its speed and ability to produce polished visuals, makes it accessible to those without technical expertise. Graphy enables teams to collaborate effectively, facilitating quick, data-driven decisions through visually compelling presentations.
This tool’s ease of use, combined with its speed and ability to produce polished visuals, makes it accessible to those without technical expertise. Graphy enables teams to collaborate effectively, facilitating quick, data-driven decisions through visually compelling presentations.
- Create stunning, interactive graphs you’ll be proud to share.
- Generate AI-powered insights and chart recommendations.
- Connect Google Sheets and paste data from anywhere.
- Share graphs as embeds, interactive links, or images.
- Annotate graphs with visual annotations and enhancements.
No video tutorial available for this AI tool yet.
We're working on adding video tutorials for this tool.
- Tableau
- Google Charts
- Microsoft Power BI